Try VOLT Intelligence
Get StartedTry VOLT Cloud
Deploy GPUTable of Contents
- Understanding GPU as a Service: Financial Fundamentals
- What AI Startups Need to Know About GPUaaS
- ROI Measurement Framework for GPU Infrastructure
- Key Performance Indicators for GPU Investments
- Time-to-Value Analysis Methods
- Risk-Adjusted Return Calculations
- Budget Optimization Strategies by Company Stage
- Series A (Sub-a substantial sum ARR): Capital Preservation Strategy
- Series B (a substantial sum-a substantial sum ARR): Efficiency Scaling Strategy
- Series C (a substantial sum+ ARR): Enterprise Optimization Strategy
- Cost Modeling Templates and Calculators
- Monthly GPU Spend Forecasting
- Baseline Continuous Workloads
- Scheduled Batch Processing
- Ad-Hoc Experimentation
- ML Engineer GPU Consumption Benchmark
- Workload-Based Cost Estimation
- Cost Estimation Framework by Workload Type
- Right-Sizing Strategy
- Multi-Provider Cost Comparison Framework
- Key Factors in Provider Comparison
- GPU as a Service Provider Comparison
- Cost Comparison Process
- Provider Selection: Financial Due Diligence
- Pricing Model Analysis
- Contract Terms and Financial Risk Assessment
- Performance SLAs and Cost Penalties
- GPUaaS 90-Day Implementation Strategy Roadmap
- Month 1: Discovery and Baseline Establishment
- Month 2: Financial Modeling and Scenario Planning
- Month 3: Recommendations and Implementation Planning
- Ongoing Financial Monitoring Systems
- What's In A Monitoring Dashboard?
- The Bottom Line

Your GPU infrastructure choice determines your startup’s survival, not just performance. Did you know that Series B AI startups burning $200K monthly on GPUs from hyperscalers could easily reduce their burn to $60K through strategic provider selection? That's the same as hiring two engineers for a year, or extending your runway through your next funding round. That's the power of GPUs as a service.
This guide provides the financial frameworks AI startups use to evaluate GPU infrastructure options. You'll get cost modeling templates, ROI calculators, and stage-specific optimization strategies built from analyzing infrastructure decisions at 50+ AI startups from Series A through exit.
Understanding GPU as a Service: Financial Fundamentals
What AI Startups Need to Know About GPUaaS
GPUaaS is a novel infrastructure alternative to owning hardware outright. It delivers on-demand compute resources through cloud providers, eliminating the upfront capital requirements of directly owning the infrastructure. Companies pay hourly or monthly rates, and in cases like VOLT, VOLT Cloud's GPUs can be available within minutes, at a fraction of the cost of Big Tech cloud providers.
According to Fortune Business Insights' 2024 market analysis, the global GPU as a service market is projected to grow from $4.31 billion in 2024 to $49.84 billion by 2032, with a compound annual growth rate (CAGR) of 35.8% during the forecast period, primarily driven by the increasing demand for AI and machine learning workloads.
The financial appeal of GPUaaS centers on three key advantages:
- Zero upfront investment
- Usage-based pricing
- Transferred infrastructure management costs
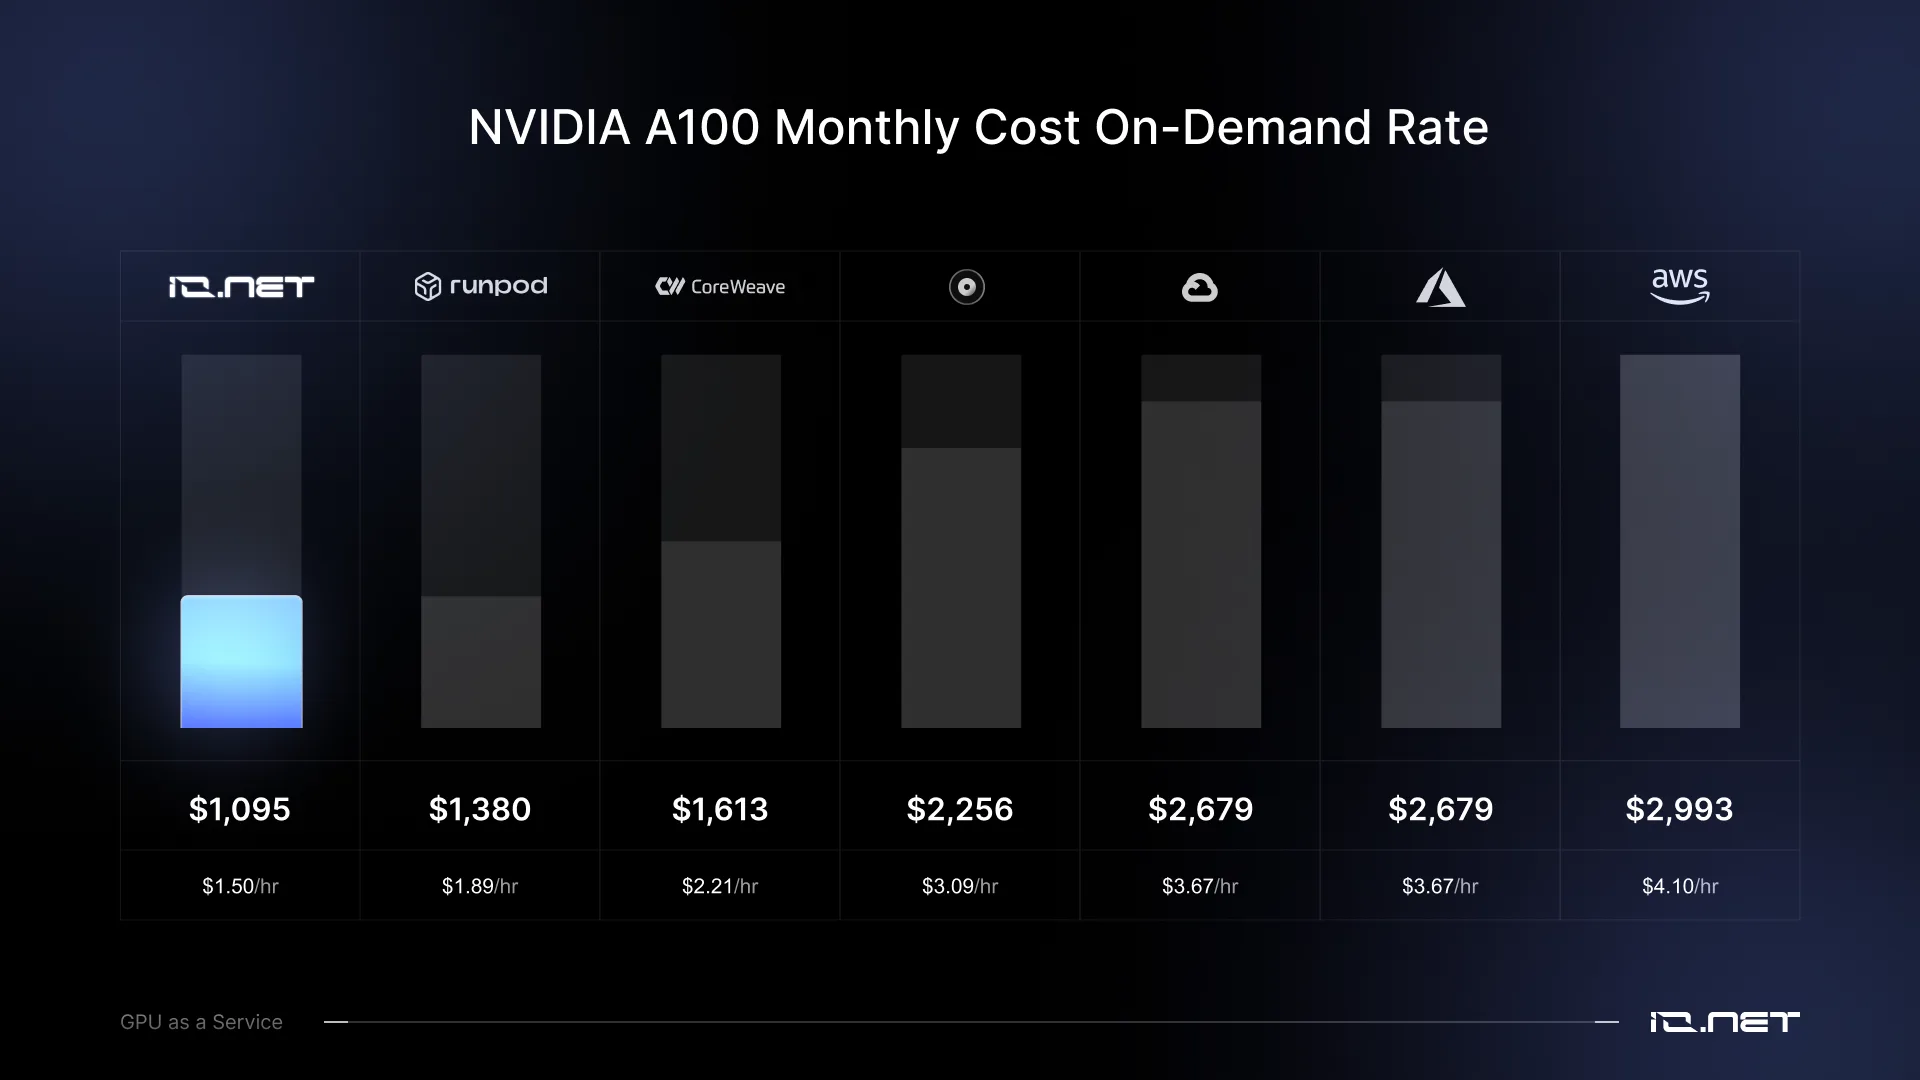
For finance teams, GPUaaS enhances cash flow predictability and minimizes balance sheet impact compared to owning hardware. However, these benefits are not equally distributed across all cloud providers. A quick comparison reveals the significant pricing discrepancies between major centralized cloud providers with established name recognition and smaller, distributed providers that leverage decentralized networks.
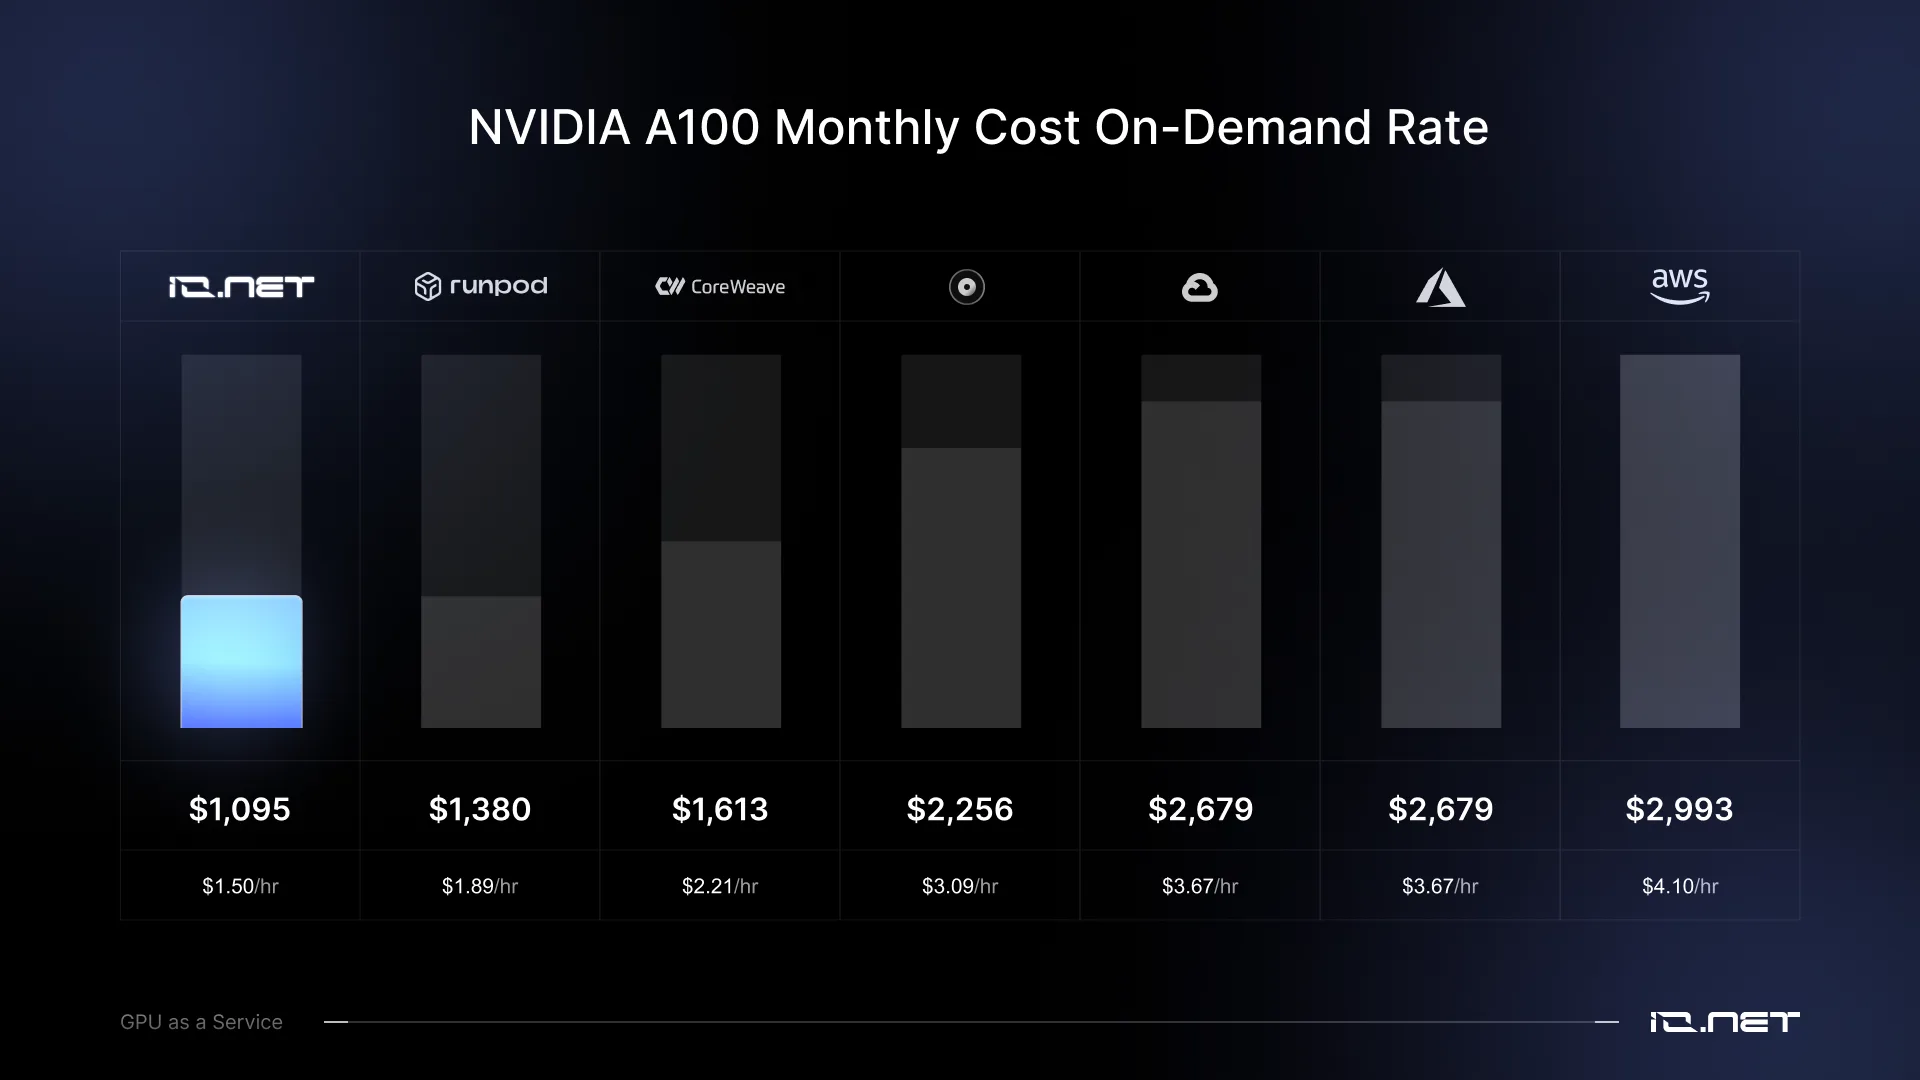
With such price discrepancies among providers offering the same GPU access, migrating workloads to the most cost-effective provider can result in significant financial savings for financial teams.
The shift toward decentralized infrastructure represents a fundamental change in how AI companies access compute resources. Decentralized GPU networks are powering the next generation of AI by aggregating underutilized hardware across global networks, delivering 50-70% cost savings compared to traditional hyperscalers.
ROI Measurement Framework for GPU Infrastructure
Key Performance Indicators for GPU Investments
To obtain accurate infrastructure ROI metrics, teams must establish KPIs that directly connect compute spend to business outcomes. The simplest way to do this is to take the number and cost of model training runs, divide the total costs by the production model versions deployed, and subtract the result. This allows companies to easily track efficiency improvements over time.
Other metrics that financial teams may want to consider when measuring ROI for GPU infrastructure can include:
- Time-to-market - Time taken to deploy a customer-facing AI feature. GPUaaS providers that can deploy immediately have a tangible ROI benefit compared to those with extended deployment waitlists.
- Resource Allocation - Impacts ROI regardless of infrastructure choice. MLPerf benchmark results demonstrate that infrastructure utilization varies significantly across implementations, with industry benchmarks suggesting AI teams average 40-60% utilization. Improving to 70-80% through better scheduling delivers equivalent ROI to a 30% price reduction.
Cost-per-inference - Cost per inference matters for production systems. As models move from training to serving customers, per-inference cost determines whether AI features contribute to unit economics.
Time-to-Value Analysis Methods
The Time-to-Value (TTV) analysis measures how quickly infrastructure investments can generate returns. For GPUaaS, TTV can take up to a couple of weeks for initial setup when dealing with larger providers. However, smaller distributed teams, such as VOLT, can connect to GPU infrastructure in minutes and begin work the same day.
Owned hardware involves significantly longer time horizons. The procurement, setup, and configuration of GPU clusters typically require 8-16 weeks, but this timeframe can be extended due to supply chain delays.
For both of these infrastructure models, time is often the most valuable commodity. A project’s ability to deploy efficiently can dramatically impact its competitive positioning in the market. With owned hardware, teams in the middle of their Series B development with a run at a rate of $200K a month, an initial 8-16 week startup timeframe represents a $400K-$800K in burned runway before a model has even been deployed.
The time-to-market advantages of near-instant setup from GPUaaS cloud infrastructure are particularly valuable during the critical early growth phase of AI startups. Companies that can deploy infrastructure within minutes rather than weeks gain significant competitive advantages in rapidly evolving markets.
Risk-Adjusted Return Calculations
Another factor that financial teams need to consider when weighing infrastructure options is the calculation of risk-adjusted returns. These issues are more prevalent in owned hardware infrastructure, where technological obsolescence is common (newer GPUs make current models inefficient and suboptimal) and can result in utilization shortfalls, especially during strategic pivots that require specialized configurations. However, the rapid advancement in GPU technology creates significant opportunity costs for organizations that commit to owned hardware or remain on outdated GPUaaS models.
Ready to cut your AI costs by 70%?
Accelerate your growth with on-demand GPUs
Budget Optimization Strategies by Company Stage
Not all projects have the same infrastructure requirements, and each funding stage has differing GPU demands.
Series A (Sub-a substantial sum ARR): Capital Preservation Strategy
Companies undergoing a Series A funding round need to prioritize capital preservation for long-term sustainability. Industry analysis indicates that early-stage AI startups typically allocate up to 80% of their technical budgets to compute infrastructure, with this percentage often increasing as they scale. McKinsey's April 2025 report on AI infrastructure projects that global investments in data center infrastructure could reach $6.7 trillion by 2030 to meet the demand for AI compute power, with $5.2 trillion allocated specifically to AI-related data center capacity.
At Series A, capital preservation takes precedence. Cloud services should be your default choice because they eliminate initial capital expenditures, reduce longer setup periods, and maintain maximum flexibility. Your primary goal is to validate product-market fit, not minimize infrastructure costs at this stage.
A robust budget strategy for Series A AI startups should involve setting strict monthly limits and implementing automated cost controls to prevent overruns. Many providers offer spending alerts and hard caps to help avoid surprise bill spikes. Companies can implement the following strategies to reduce unnecessary spend:
- Use spot instances for non-critical training - They can cut prices by up to 70% compared to on-demand instances.
- Schedule training jobs for off-peak hours when available
- Implement auto-shutdown after 30 minutes idle
- Right-size GPU selection: use T4 for development, A100 only for production training
- Leverage free tiers and credits: Google Cloud $300 credit, AWS Activate up to $100K in credits. However, AI startups should be vigilant against trading long lock-in periods for early, attractive rates with free tiers and credits.
- Shop around GPUaaS providers: Many smaller providers like VOLT have zero lock-in periods or data transfer fees.
Series B (a substantial sum-a substantial sum ARR): Efficiency Scaling Strategy
As companies approach their Series B, they begin to encounter new infrastructure pressures. Monthly spending on GPU infrastructure can quickly scale, introducing increased risk of cost overruns, particularly from high lock-in pricing models agreed upon during their early-stage development.
Series B companies must balance growth velocity with improving unit economics. Infrastructure costs for Series B AI startups often grow at 3-5 times the rate of headcount expansion, making cost management increasingly critical at this stage. Even modest efficiency improvements can generate substantial savings at this scale.
To best optimize for budget constraints at this stage, projects should establish formal cost allocation systems attributing spending to specific teams, projects, or customer cohorts. This visibility enables data-driven decisions about which AI initiatives deliver sufficient value and where to allocate additional resources.
Series C (a substantial sum+ ARR): Enterprise Optimization Strategy
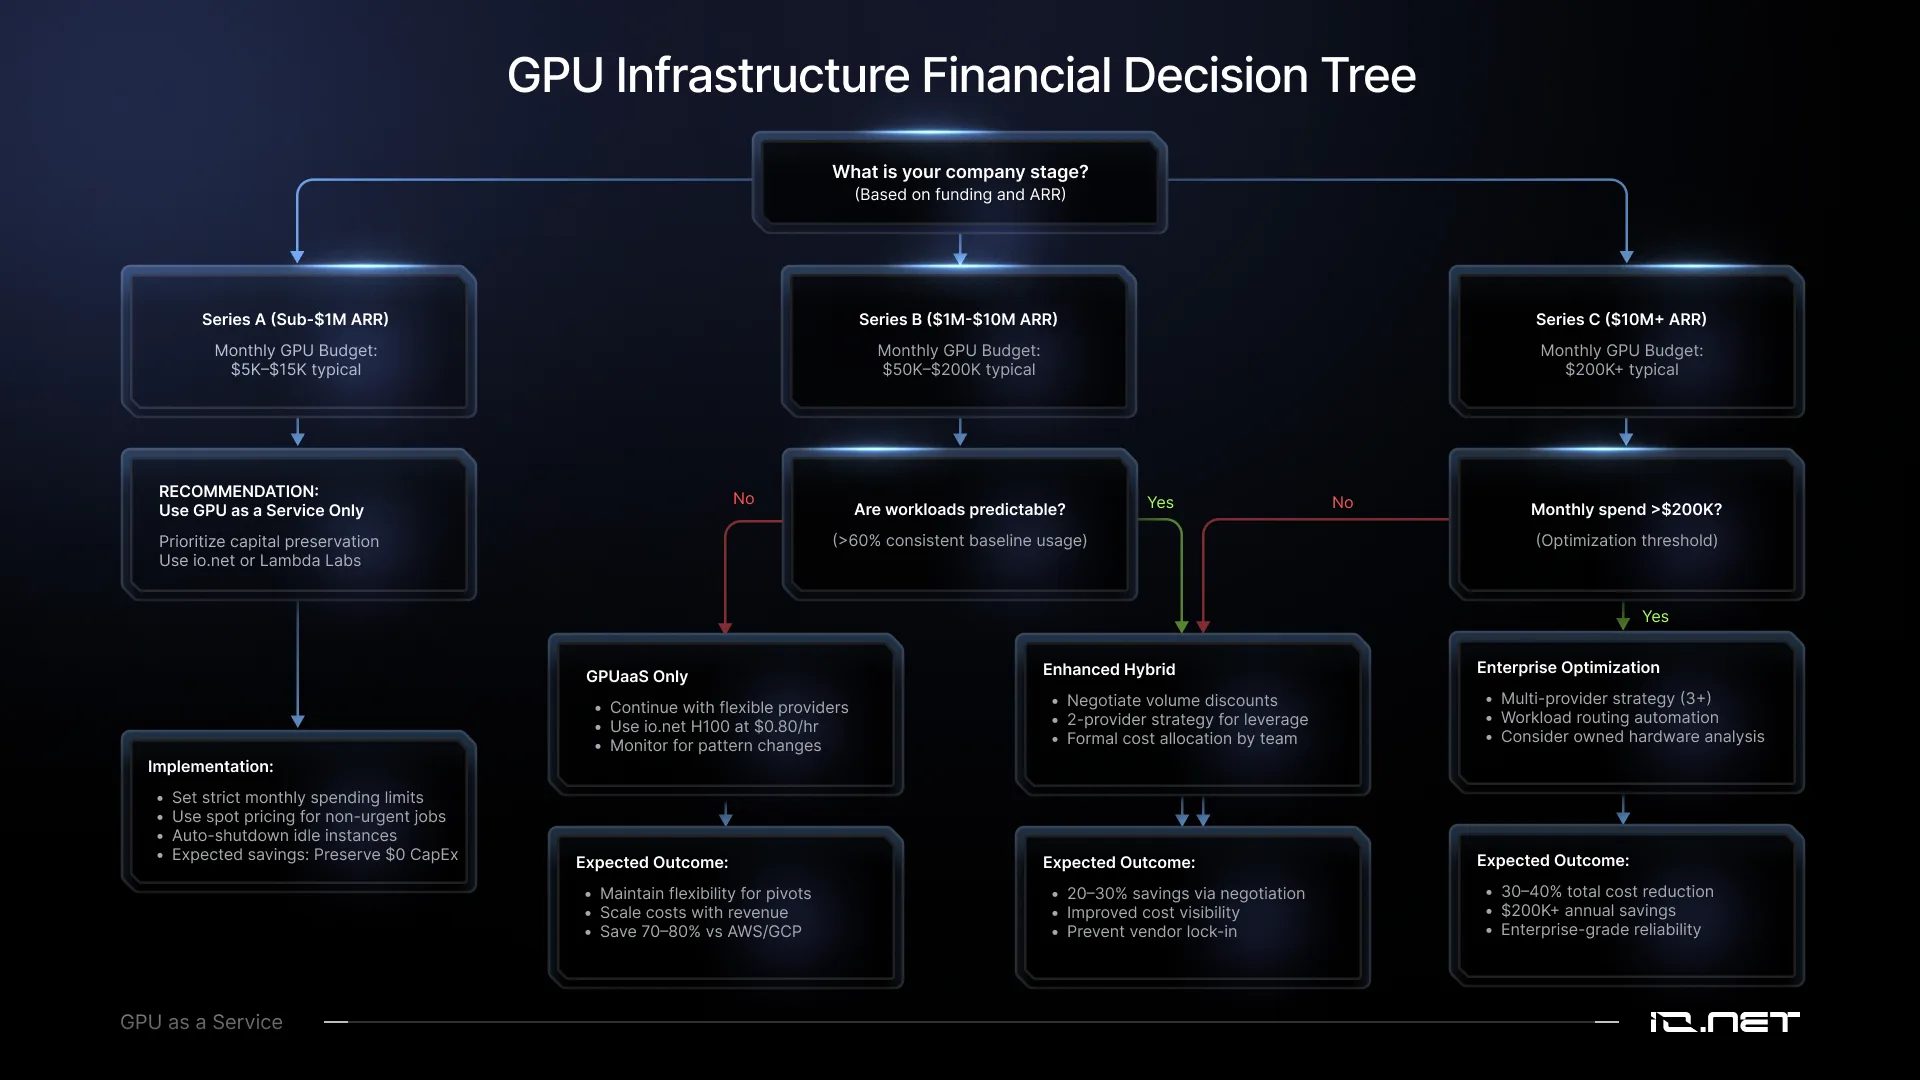
Series C companies often opt for hybrid infrastructure strategies, where they own hardware for baseline workloads and leverage GPUaaS for burst capacity. At monthly spends into the hundreds of thousands, even minor efficiency improvements can deliver meaningful budget savings.
Companies with substantial spending should implement sophisticated optimization programs and leverage multiple GPUaaS infrastructures, or integrate GPUaaS directly with their owned hardware infrastructure for short burst workloads. At this scale, even a 10% efficiency improvement can translate to multiple six-figures in annual savings.
These advanced techniques can include workload scheduling systems that automatically route jobs to cost-effective resources, auto-scaling policies that shut down idle instances within minutes, and regular architectural reviews that identify model efficiency improvements that reduce compute requirements.
McKinsey research on cloud cost optimization indicates that companies can achieve 15-25% cost reductions through targeted optimization practices, including better workload management, automated resource allocation, and strategic vendor negotiations. At Series C scale, implementing sophisticated multi-cloud strategies with proper workload orchestration can deliver meaningful cost advantages.
Infrastructure costs don't have to scale linearly with growth. Learn how to scale AI infrastructure without getting strangled by costs through strategic workload distribution and hybrid deployment models.
Cost Modeling Templates and Calculators
Monthly GPU Spend Forecasting
Accurate monthly GPU spend forecasting is critical for all good AI startups, and can be easily achieved by categorizing GPU compute consumption into three categories:
- Baseline continuous workloads (24/7)
- Scheduled batch processing (Predictable but intermittent)
- Ad-hoc experimentation (Unpredictable)
Baseline Continuous Workloads
These are always-on services that run 24/7, 730 hours per month. A simple formula can easily calculate the cost modeling, but it should take into account the different GPU model demands for each stage to optimize usage and costs:
Production inference serving:
- Example: 4× A100 GPUs × 730 hours × [Your provider's A100 rate]
Continuous model training pipeline:
- Example: 2× H100 GPUs × 730 hours × [Your provider's H100 rate]
Development environments:
- Example: 3× T4 GPUs × 730 hours × [Your provider's T4 rate]
Calculate your baseline subtotal by adding all continuous workloads.
Scheduled Batch Processing
These are predictable, recurring jobs that run on a schedule:
Weekly full model retraining:
- Example: 8× A100 × 12 hours/week × 4.33 weeks × [Your provider's A100 rate]
Daily dataset preprocessing:
- Example: 4 × T4 × 2 hours/day × 30 days × [Your provider's T4 rate]
Monthly model evaluation suite:
- Example: 16× A100 × 8 hours × 1 run × [Your provider's A100 rate]
Calculate your batch subtotal by adding all scheduled workloads.
Ad-Hoc Experimentation
Research and development work with unpredictable usage patterns:
Estimation approach: Use 20-30% of your baseline continuous workload spend as a buffer for experimentation, prototyping, and unplanned compute needs.
Total Monthly Forecast Formula:
Note on Pricing: GPU pricing varies significantly by provider, region, and pricing model (on-demand vs. reserved vs. spot instances). Always verify current pricing directly with providers before budgeting, as rates can change quarterly and may differ by 60-80% between hyperscalers and decentralized providers.
ML Engineer GPU Consumption Benchmark
Use these ranges to estimate GPU costs per team member:
- Junior ML Engineer: $2.5K-$4K/month (primarily development, light training)
- Senior ML Engineer: $5K-$8K/month (production model development, frequent training)
- Research Scientist: $8K-$15K/month (extensive experimentation, large-scale training)
- ML Platform Engineer: $1K-$3K/month (infrastructure optimization, tooling)
These benchmarks help translate headcount planning into GPU budget requirements.
*Salaries range per country and region.
Ready to cut your AI costs by 70%?
Accelerate your growth with on-demand GPUs
Workload-Based Cost Estimation
Different AI workloads generate vastly different costs. Performance comparison studies from MLCommons demonstrate that training costs vary by up to 300% across different GPU types and cloud providers for identical workloads, underscoring the importance of workload-specific cost analysis.
Cost Estimation Framework by Workload Type
Large Language Models:
- Training from scratch: 1,000 × GPUs, 30-40 days × [Provider hourly rate]
- Fine-tuning: 32-64 GPUs, 4-10 days x [Provider hourly rate]
- Inference: Depends on throughput requirements and model size
Computer Vision Models:
- Small models (ResNet-50): 8 GPUs x ~1 hour x [Provider hourly rate]
- Medium models (YOLO v8): 8 GPUs x 4-8 hours x [Provider hourly rate]
- Large models (ViT): 16 GPUs x 12-24 hours x [Provider hourly rate]
Recommender Systems:
- Collaborative filtering: 4 GPUs x 6-10 hours x [Provider hourly rate]
- Deep learning recommendations: 8 GPUs x 10-15 hours x [Provider hourly rate]
Natural Language Processing:
- BERT-Base: 8 GPUs x 2-4 hours x [Provider hourly rate]
- BERT-Large: 16 GPUs x 3-5 hours x [Provider hourly rate]
Workload costs formula:
*Add a 20-30% buffer for failed runs, hyperparameter tuning iterations, and model evaluation.
Right-Sizing Strategy
Key Insight: Development and testing should use smaller, less expensive GPU tiers. Many teams overspend on high-performance configurations for activities that run adequately on mid-tier alternatives costing 20-25% less.
Right-Sizing Framework:
Development work:
- Use: T4 or equivalent entry-level GPUs
- Typical cost difference: 80-85% cheaper than premium GPUs
- Performance impact: 10-20% slower for typical development tasks
- When to use: Code development, debugging, small-scale testing
Training experiments:
- Use: A10G, L4, or mid-tier GPUs
- Typical cost difference: 60-70% cheaper than premium GPUs
- Performance impact: 30-40% slower
- When to use: Hyperparameter tuning, model architecture experiments
Production training:
- Use: A100, H100, or premium GPUs
- When to use: Final model training runs, time-sensitive workloads
Annual savings formula:
Ready to cut your AI costs by 70%?
Accelerate your growth with on-demand GPUs
Multi-Provider Cost Comparison Framework
Comparing cloud pricing across providers requires normalizing for performance differences. Real-world training performance can vary by 20-40% across providers due to differences in network architecture, storage systems, and virtualization overhead.
Key Factors in Provider Comparison
1. Base hourly rates
- On-demand pricing (highest flexibility, highest cost)
- Reserved instances
- Spot instances (up to 70% discounts, interruptible)
2. Hidden costs
- Data transfer fees (can add 10-20% to total costs)
- Persistent storage costs
- Reserved IP addresses
- Support tier requirements
3. Performance variations
- Network throughput (affects multi-GPU training)
- Storage I/O speed (impacts data loading)
- GPU interconnect quality (critical for distributed training)
4. Lock-in considerations
- Minimum commitment periods
- Early termination penalties
- Data egress costs (exiting the platform)
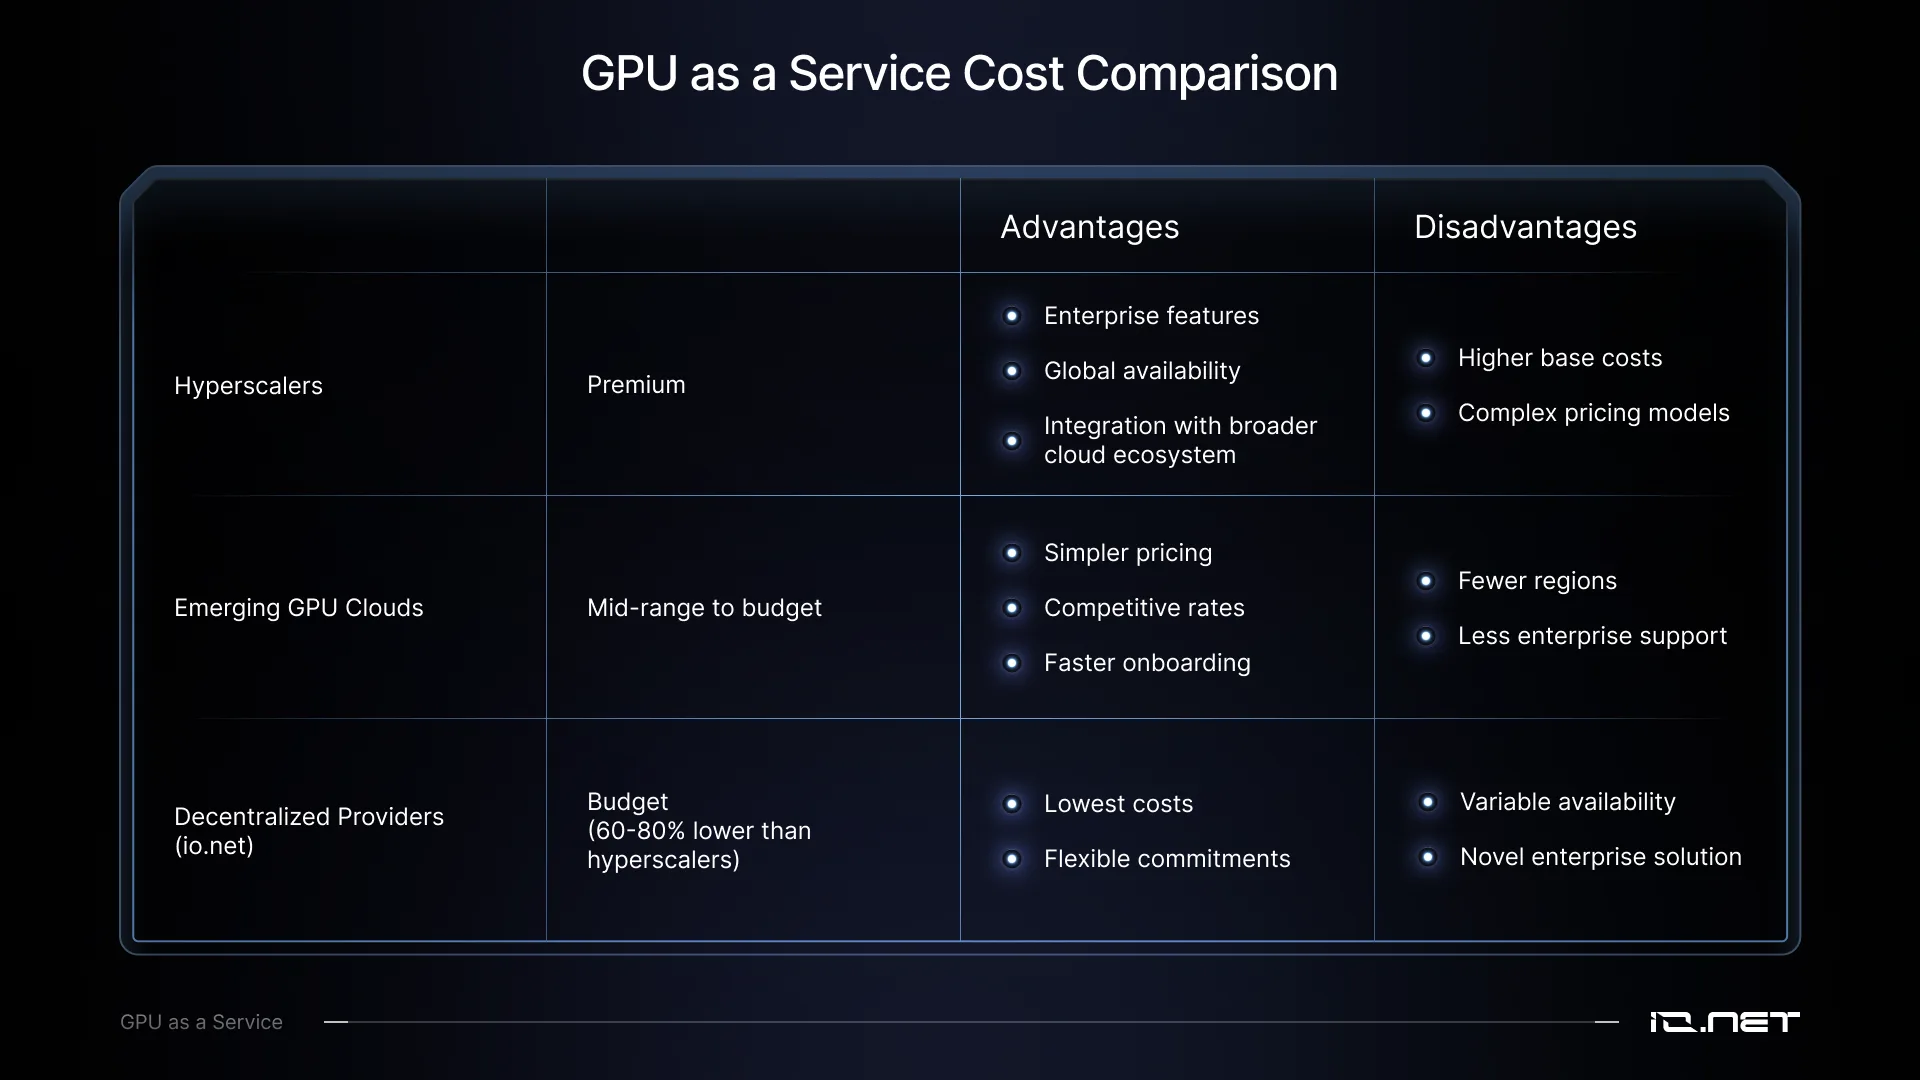
GPU as a Service Provider Comparison
Here's a comparison table of GPU cloud providers:
Cost Comparison Process
- Identify your workload profile: Baseline, batch, and ad-hoc requirements
- Request quotes from 3-5 providers for identical GPU configurations
- Calculate total cost of ownership including hidden fees
- Run benchmark tests on 2-3 top candidates
- Normalize for performance: Adjust costs based on actual training times
- Factor in operational costs: Consider support needs and internal management overhead
Flexibility Consideration: Consider the impact flexibility has on your demand and how much your project can benefit from a GPUaaS OpEx model. Many enterprise providers require minimum-term or demand commitments, locking your project into a single provider for extended periods. For early-stage companies that need to prioritize capital preservation, zero-commitment providers offer strategic advantages over enterprise lock-ins, despite paradoxically having to pay higher per-hour rates.
Provider Selection: Financial Due Diligence
Pricing Model Analysis
Gartner's cloud pricing analysis provides a comprehensive overview for financial teams to easily assess the diverse pricing models offered by various cloud providers.
Teams should understand the benefits and drawbacks of on-demand vs. committed capacity pricing models, as well as the role reserved capacity plays. Larger enterprise providers often seek to have AI startups commit to reserved capacity or savings plans that require committing to specific usage levels (usually 1-3 years) in exchange for discounts of 30-50%. These pricing models are better suited to companies in their Series B or C stages that have predictable baseline workloads but can create substantial risk for earlier-stage companies.Companies looking at reserved capacity models should calculate their break-even utilization rates before committing. This can be achieved by looking at their minimum usage under on-demand pricing and comparing it to the average of their committed rates.
Contract Terms and Financial Risk Assessment
GPU provider contracts contain provisions that can substantially impact a project’s financial risk. Financial teams should be aware of minimum commitment clauses that obligate spending regardless of actual usage, and negotiate more favourable terms.
Key Contract Provisions to Negotiate with Committed Capacity:
- Minimum spend commitments
- Overage pricing
- Early termination penalties
Key Insight: Committed Capacity provisions effectively convert OpEx back into a capital commitment, eliminating the flexibility advantage of GPUaaS.
Robust SLAs that clearly define the parameters of committed capacity provisions can reduce service inflexibility and protect teams by legally defining availability guarantees and remedies for outages. Another advantage of leveraging SLAs is that they usually include price-protection clauses that specify whether providers can increase rates during your contract term.
Performance SLAs and Cost Penalties
Performance SLAs are essential for financial teams when exploring GPUaaS infrastructure options. Some providers may offer lower hourly/monthly fees or shorter lock-in periods, but if their infrastructure can’t guarantee performance, the cost advantage evaporates. Teams should request ironclad benchmark data or conduct trials with representative workloads before committing to a provider.
Performance variation exists even within the same provider's infrastructure, with job completion times varying by up to 25% depending on data center location, time of day, and network congestion. These discrepancies in performance can significantly impact time-to-market and ultimately increase the opportunity costs of delayed deployment.
Companies should take the following steps before committing to any provider to give themselves the best overview of what performance metrics truly look like:
- Run representative workloads: Test your actual model training code, not synthetic benchmarks
- Measure end-to-end time: Include data loading, training, and checkpoint saving
- Test at different times: Performance can vary by 15-30% based on network congestion
- Calculate total job cost: Multiply completion time by hourly rate for true cost comparison
- Verify repeatedly: Single runs can be misleading; test 5-10 times for statistical validity
Key Insight: Evaluate total job cost rather than hourly rates when comparing alternatives. The cheapest per-hour rate rarely delivers the lowest total cost for data-intensive AI workloads.
Ready to cut your AI costs by 70%?
Accelerate your growth with on-demand GPUs
GPUaaS 90-Day Implementation Strategy Roadmap
Month 1: Discovery and Baseline Establishment
Month one should focus on establishing baseline visibility into current spending patterns. Teams should implement cost-tracking systems that categorize spending by team, project, and workload type and conduct workload analysis to understand utilization patterns, performance requirements, and cost drivers.
Before exploring infrastructure options, teams should interview engineering leads to understand which workloads have consistent resource needs versus those with variable or experimental requirements at this stage. This analysis provides the foundation for informed decisions about committed capacity, spot usage, or owned hardware investments.
Month 2: Financial Modeling and Scenario Planning
Month two focuses on financial modeling and scenario planning. Building models that compare cloud continuation, hybrid approaches, and owned hardware across different growth scenarios. Teams should use this time to incorporate realistic utilization projections rather than best-case assumptions. Include a sensitivity analysis showing how results change when key assumptions differ from forecasts.
Month 3: Recommendations and Implementation Planning
Month three involves developing recommendations, preparing board presentation materials, and initiating necessary procurement or contract-negotiation processes. During this period, financial teams should work closely with engineering leadership.
Ready to cut your AI costs by 70%?
Join 500+ companies already saving up to 70% on compute costs.
Ongoing Financial Monitoring Systems
To achieve ongoing success, financial teams should implement automated cost monitoring to provide real-time visibility into spending trends. Setting up dashboards that track daily spending rates, comparing actual costs against budgets, and highlighting anomalies requiring investigation.
Many cloud providers offer native cost management tools, while open source systems, such as Kubernetes, provide multi-provider visibility.
What's In A Monitoring Dashboard?
Executive Dashboard (updated daily):
- Current month spend vs. budget (with forecast to month-end)
- Week-over-week and month-over-month trends
- Top 10 cost drivers by project/team/resource
- Anomaly alerts (>20% deviation from expected patterns)
- Utilization metrics by GPU type
Engineering Dashboard (real-time):
- Active GPU instances by team and user
- Cost per active job/experiment
- Queue depth and wait times
- Utilization by resource (identify idle GPUs)
- Spot interruption rates
Financial Planning Dashboard (updated monthly):
- Actual vs. budget by cost center
- Quarterly spend trajectory
- Cost per ML engineer (benchmarking metric)
- Reserved capacity utilization tracking
- Provider pricing trend analysis
Continued collaboration between finance and engineering teams is key to the long-term success of any project, and establishing monthly cost review processes that bring these teams together helps ensure continued alignment with the project's goals. These reviews should examine spending trends, identify optimization opportunities, and adjust budgets in line with evolving requirements. Regular reviews prevent gradual cost creep occurring when individual decisions accumulate into materially higher spending.
Establish accountability mechanisms that attribute costs to specific teams or projects. When engineering teams have visibility into how their decisions impact costs, they naturally optimize more effectively than when finance simply pays bills without attribution. Some companies implement internal chargebacks or budget allocations, though lighter-weight visibility can achieve similar results without the administrative overhead.
The Bottom Line
GPU infrastructure decisions have a significant impact on the financial performance of AI companies, but optimal choices vary depending on the company's stage, workload characteristics, and growth projections.
Series A companies should default to flexible GPUaaS despite higher per-unit costs. Series B companies should evaluate hybrid approaches as workloads stabilize. Series C companies should implement sophisticated optimization programs delivering 30-40% cost reductions.
With the financial frameworks above, financial teams should be well-equipped to tackle the ever-evolving landscape of GPUaaS. Ready to implement these cost optimization strategies? Deploy your first on demand GPU cluster on VOLT Cloud and start reducing your infrastructure spend today.